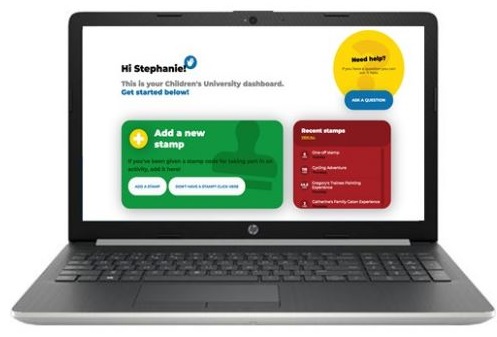
Schools are given a secure log-in to access their own school-level dashboard. Schools can then administer children’s accounts and view their pupils’ participation. They can also add and validate their own extra-curricular activities taking place within the school, at lunch time or after the bell rings.
At a glance, schools can view simple but important reports showing:
• participation by gender and age group within the school
• the school’s extra-curricular offering and participation according
to skills and categories
• cold spots/areas of success and high engagement among pupils
• their pupils’ engagement with HE/FE and employers in line with the Gatsby Benchmarks
This screenshot from CU Online illustrates the kind of information that is generated at a school, local and national level. Seen here is a graph showing the availability of activities (quantity) for children in the New Forest Children’s University as per the tagged skills.

Actionable data such as this enables schools to make better decisions regarding their extra-curricular offer and can be used to demonstrate their provision to stakeholders such as parents, colleagues, Ofsted and the Local Authority. For example, in the illustration above one can see that there are significant numbers of activities geared towards developing creativity in participants. Proportionally, there are far fewer activities that will provide participants the opportunity to develop their leadership skills